blitz.* — Seven Open-Source Bar Widgets for Omarchy

My workstation runs Omarchy, DHH's Arch + Hyprland + QuickShell distribution. The bar is the one surface you look at all day, and I kept hitting the same wall: every service I care about — CI runs, Docker stacks, VMs, tailnets, AI quotas — lived behind a browser tab, while the bar sat there showing only the clock.
So I built a family of bar widgets, one per concern, and published each as its own repo under the blitz.* namespace. All seven are open source, install with one command, and follow the same small pattern.
The pattern
Every widget is a standard Omarchy plugin — a directory with three pieces:
manifest.json— declares the plugin id (blitz.docker,blitz.stats, ...), thebar-widgetkind, and the default bar section it belongs in.BarWidget.qml— the QuickShell UI: a compact chip on the bar that expands into a full panel on click.- A Python collector — a small script the QML polls that emits one JSON line with everything the panel needs. All the system interaction (CLI calls,
/procparsing) lives in Python where it's testable; all the UI lives in QML where it hot-reloads.
Chips stay compact and idle until there is something to say, then expand on their own — a repo name appears when CI runs, a counter turns red when a container dies. You place them with the Omarchy plugin system:
omarchy plugin add https://github.com/itz4blitz/blitz.docker.git --enable
omarchy bar move blitz.docker --section right
The bar layout lives in ~/.config/omarchy/shell.json and hot-reloads on save, so adding and moving chips takes seconds.
blitz.stats — CPU, RAM, disk, GPU, network
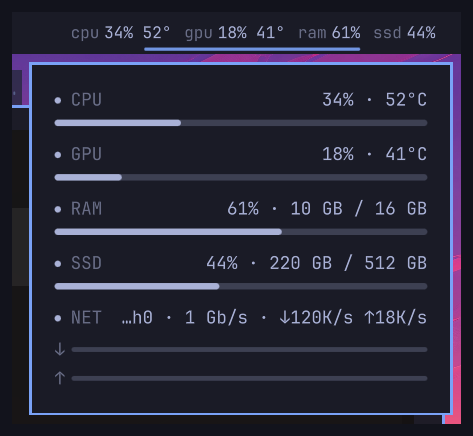
The foundation chip. CPU usage and temperature, RAM, disk, network link speed, and GPU when nvidia-smi is present.
The collector is deliberately dependency-free: CPU comes from a 1-second /proc/stat delta (sampled across the same window as the NIC counters, so the numbers agree), RAM from /proc/meminfo, temperature from sensors -j, disk from df. One detail I'm fond of: when the default route rides a virtual device — WireGuard, a bridge, a veth — the widget walks down to the physical NIC underneath to report the real link speed, since tunnels have none.
blitz.actions — GitHub CI on the bar
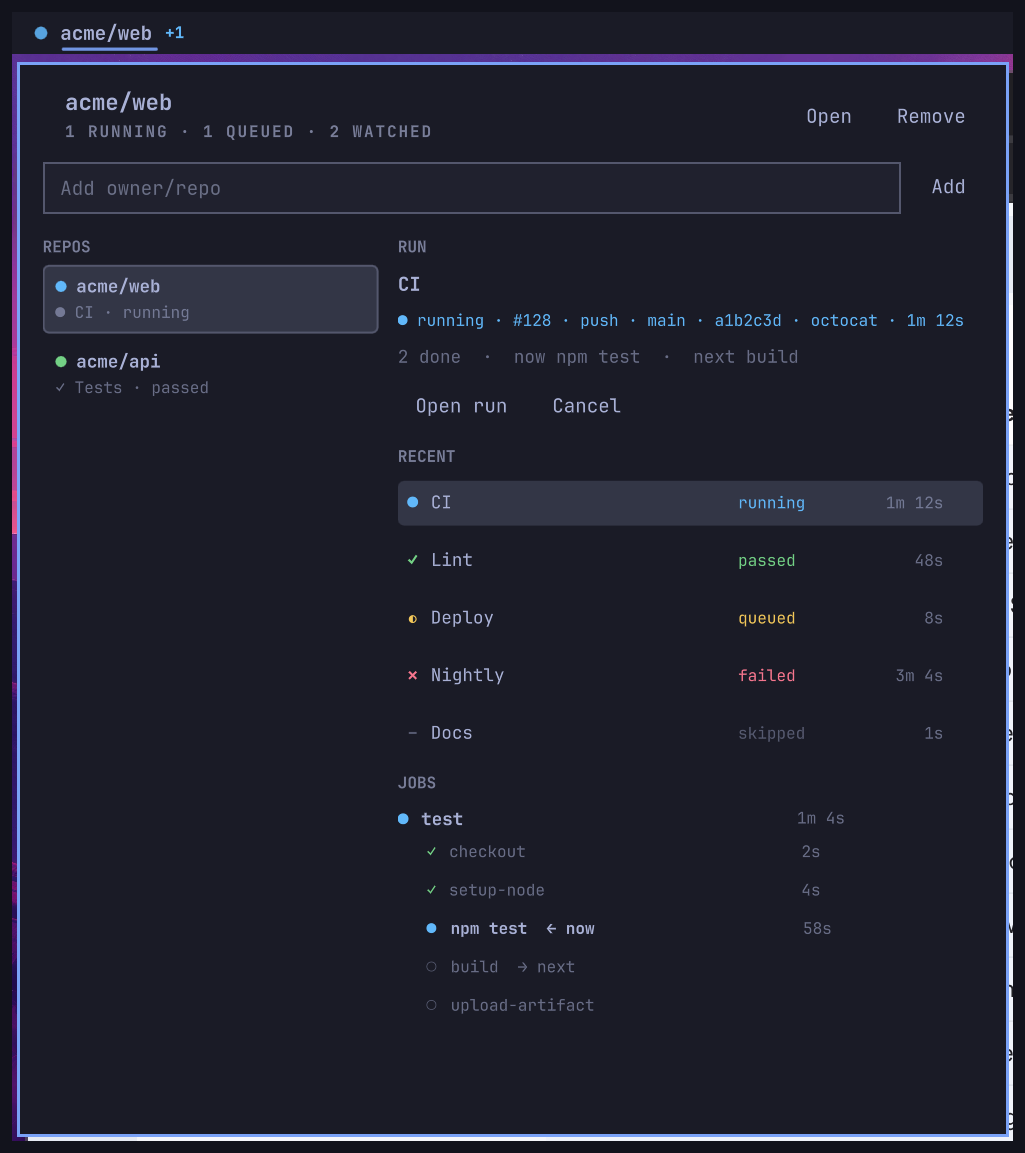
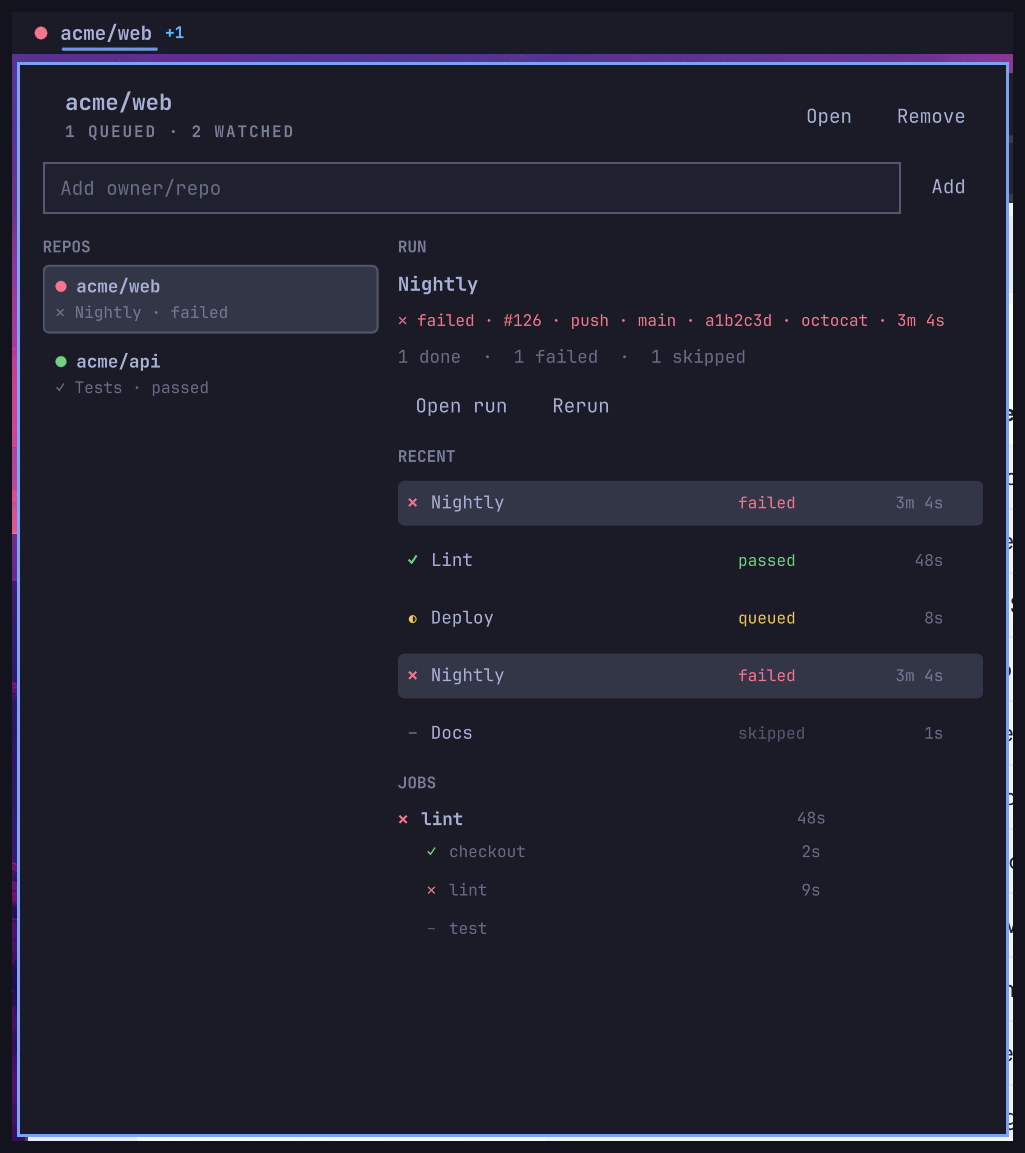
Idle, the chip is just gh. The moment a watched repo has a run queued or in flight, it expands to Org/Repo with a live status pip. Click opens a panel with the job and step timeline — pass, fail, queued, running, skipped — plus Open, Cancel, and Rerun actions. Right-click jumps straight to the run in the browser.
Auth is whatever your local gh login already is (repo + read:org scopes). The watch list is a repos.json next to the plugin, gitignored, edited from the panel itself — type owner/repo or paste a GitHub URL.
Polling ramps from ~10 seconds while idle to ~1 second while anything is live. GitHub has no desktop push API for Actions, so this is the same approach gh run watch uses — just always on, in the corner of your eye.
blitz.docker — stacks and containers
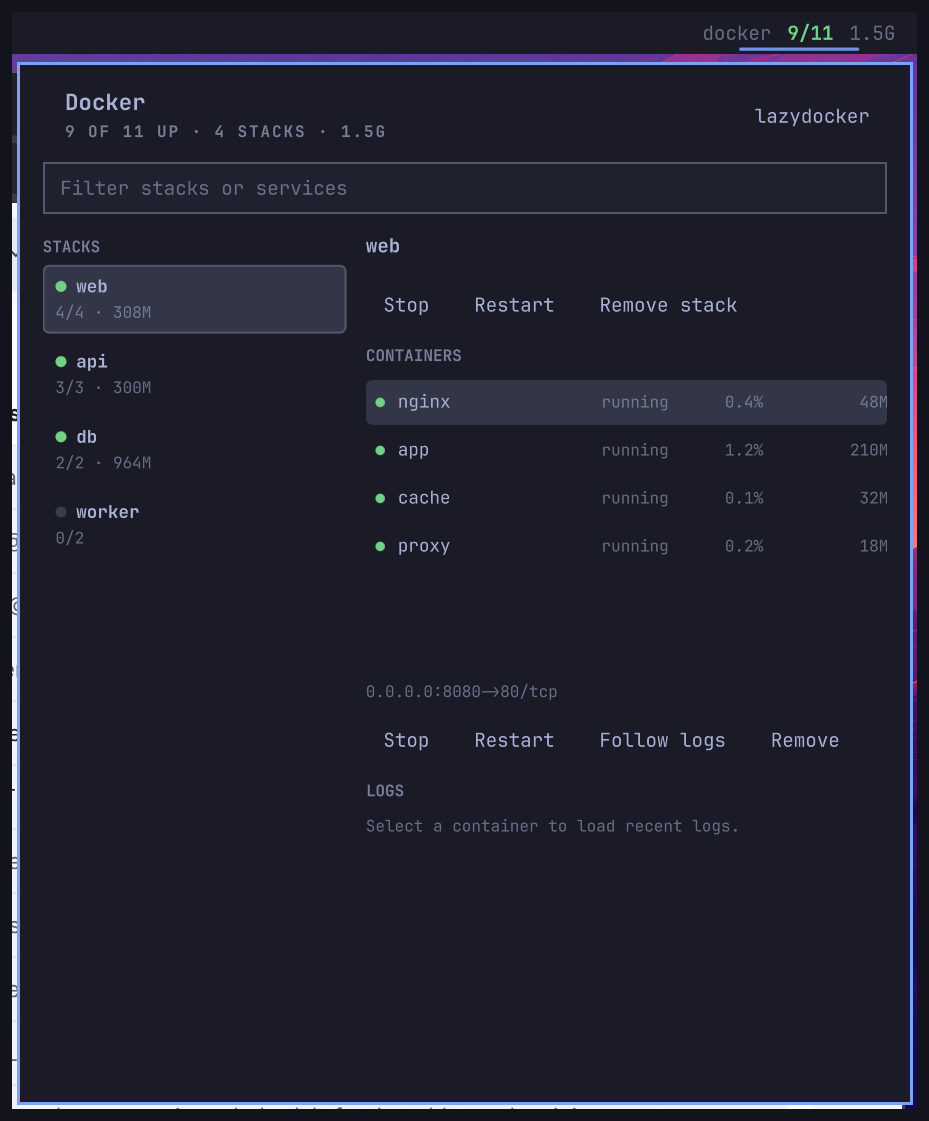
Running/total containers, CPU and memory per stack, and per-container actions: start, stop, restart, and a log viewer. The panel has a filter box that matches stack names, service names, and container names, which matters once you're past a few compose stacks.
It shells out to the docker CLI — no socket mounting, no daemon API wiring. If your user can run docker ps, the chip works.
blitz.vm — libvirt at a glance
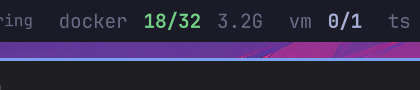
A chip for libvirt VMs on qemu:///system: start, ACPI shutdown, restart, force off, and open in virt-viewer windowed or fullscreen. Mine currently watches exactly one machine:
{
  "ready": true,
  "status": "ok",
  "uri": "qemu:///system",
  "running": 0,
  "total": 1,
  "domains": [
    {
      "name": "win10",
      "title": "Windows 10 LTSC (gaming VM)",
      "state": "shut off"
    }
  ]
}
Needs the virsh CLI (plus libvirt group membership) and virt-viewer for the console action.
blitz.tailscale — every tailnet you're on
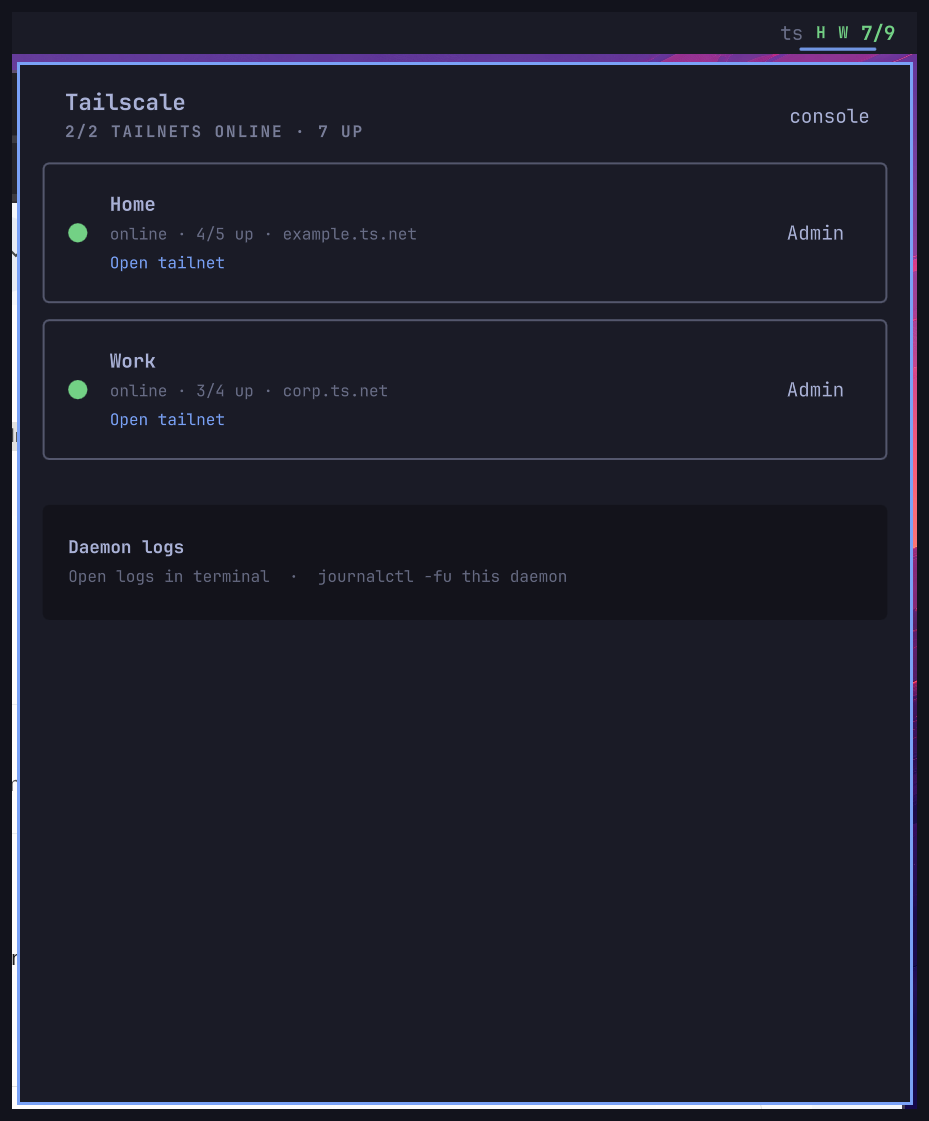
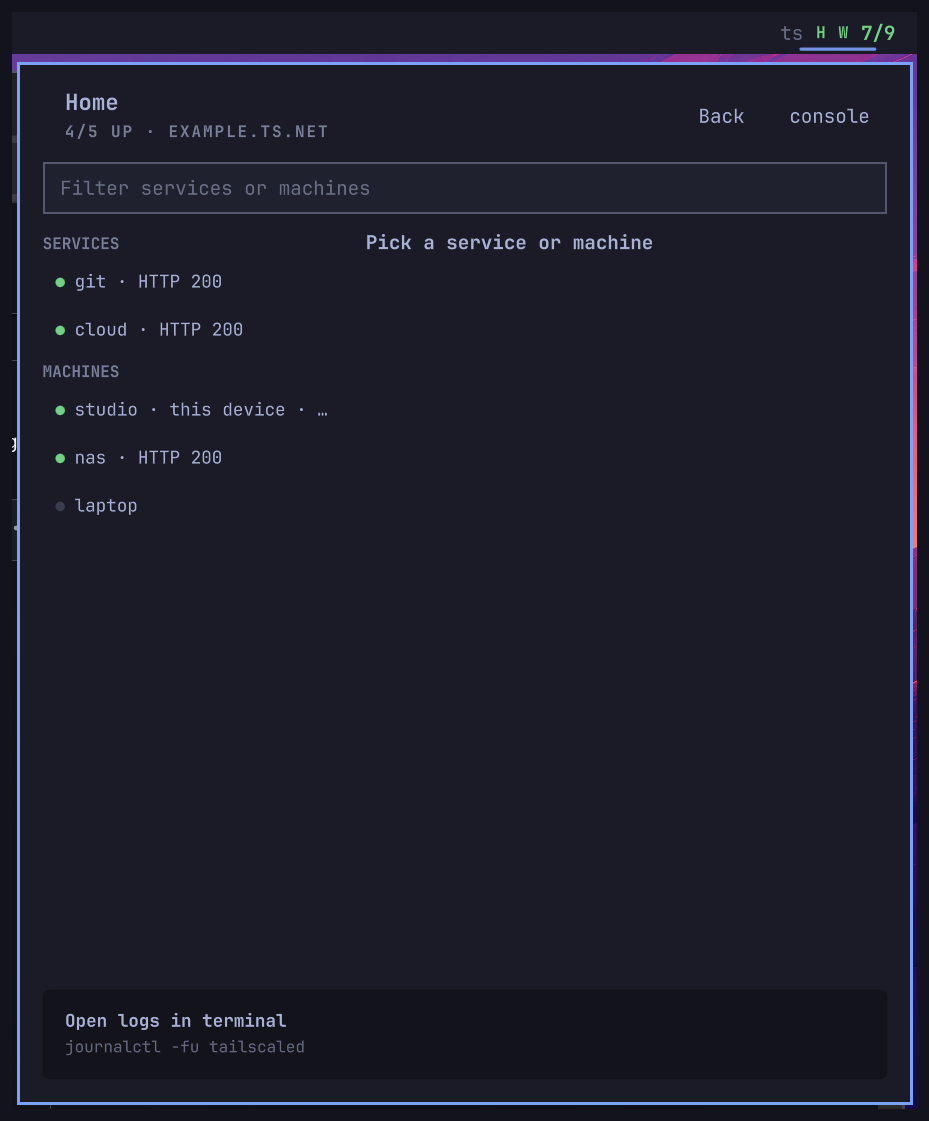
Most Tailscale widgets assume one account. I'm on more than one tailnet, so this chip uses whatever account tailscale status is logged into plus any extra /run/tailscale-*.sock daemons — a second tailnet, a userspace instance, whatever exists — with no account names hardcoded. The panel shows machines, online state, and Tailscale Services, and the chip's pip reflects the state of the connection you actually care about.
blitz.ai — local AI provider quotas
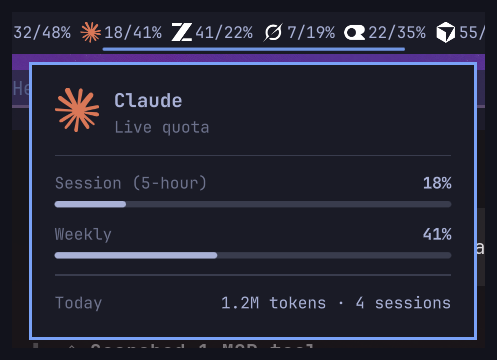
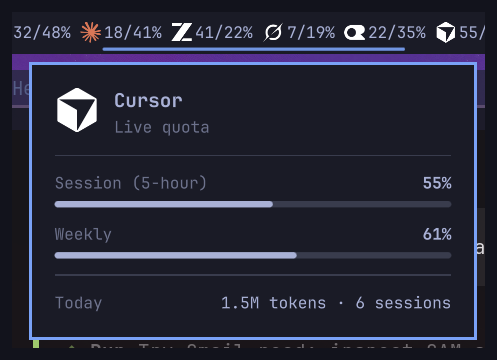
A quota chip for the AI providers installed on the machine — Codex, Claude, Z.ai, Grok, OpenRouter, Cursor. It discovers whatever accounts exist locally and shows how much of the current window is burned. No API keys are stored in the repo; if you don't want to export OPENROUTER_API_KEY, you can point it at a 1Password reference from a gitignored secrets.json:
{"openrouterOp": "op://Vault/Item/credential"}This is the chip that made me stop keeping five provider dashboards pinned in a browser window.
blitz.followcast — screen-share privacy state
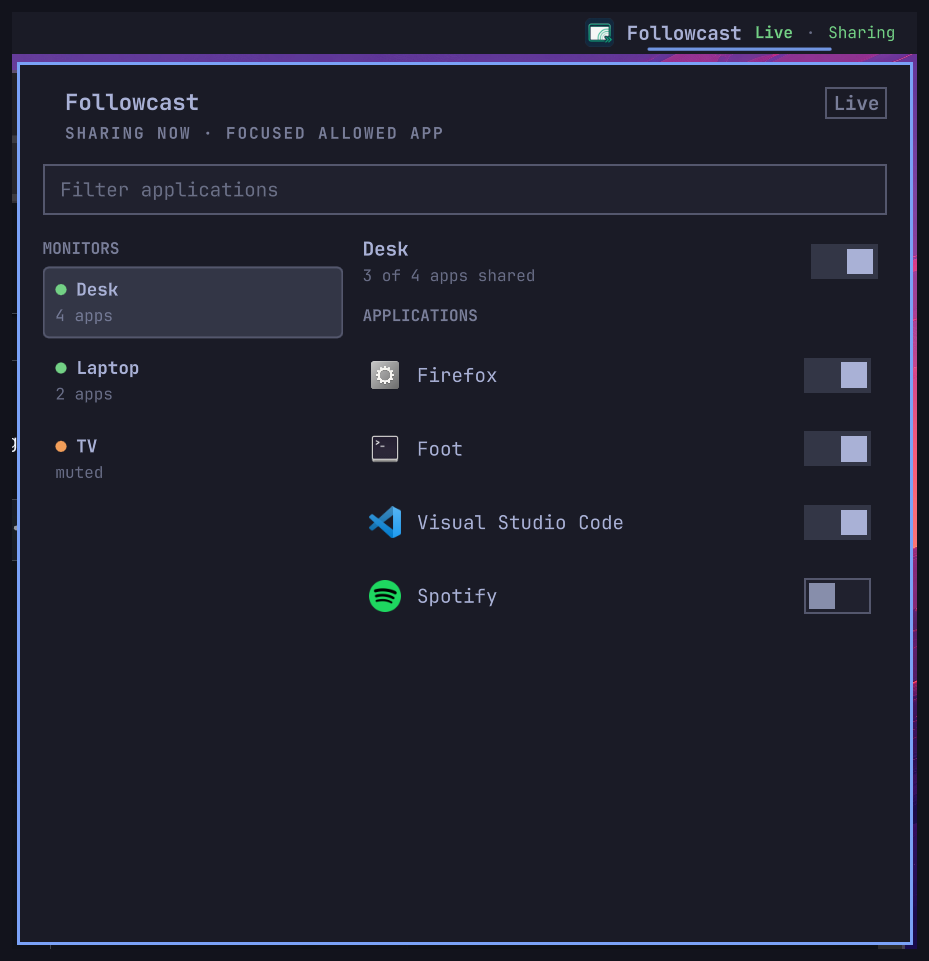
A companion chip for Followcast, my tool for sharing a single monitor region instead of a whole screen. While a share is live, this chip shows it and can mute monitors and apps, so a notification popup on another screen doesn't leak into a recording. The Followcast CLI isn't on npm — install it from the GitHub release, then add the chip.
Install any of them
Every repo follows the same two lines:
omarchy plugin add https://github.com/itz4blitz/<repo>.git --enable
omarchy bar move <repo> --section right| Repo | Chip |
|---|---|
| blitz.stats | CPU, RAM, disk, GPU, network |
| blitz.actions | GitHub Actions across watched repos |
| blitz.docker | Docker stacks and containers |
| blitz.vm | libvirt VMs |
| blitz.tailscale | Any Tailscale account |
| blitz.ai | Local AI provider quotas |
| blitz.followcast | Followcast share privacy |
The plugin directory is the live install (~/.config/omarchy/plugins/<id>), so hacking on a widget is just editing files — saving QML or Python reloads the shell. Each repo ships its collector tests (python3 test_*_collect.py), which is most of why the family stayed fun to grow: seven widgets, one pattern, zero new dashboards.